Exploring Instantaneous Speed in Grade 5
A Design Research
Huub de Beer
2016
1 Introduction
In answer to the call for innovative primary school STEM education to better prepare our children for participation in the information society, a design research project was started to explore how to teach instantaneous speed in the 5th grade.
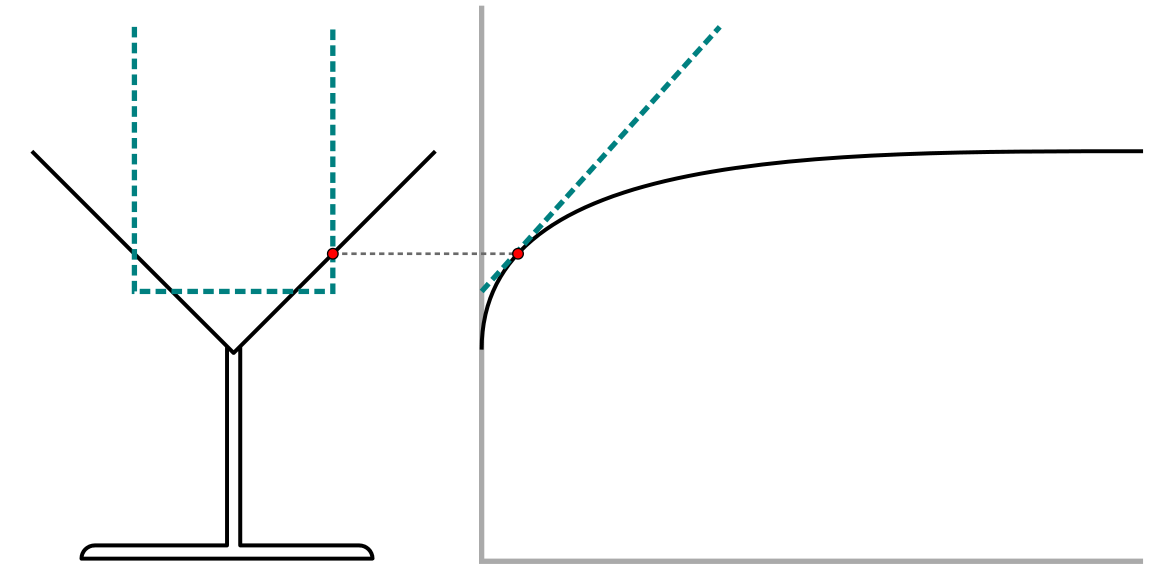
The local instruction theory developed in the design research project assumes that fifth-grade students are familiar with the context of filling glassware with water, and starts with the task to model the speed with which a cocktail glass fill ups. Via a process of repeated modeling and refinement, in which they improve their model, the students are expected to develop two models of the changing water height, a discrete bar graph and a segmented-line graph. When scrutinizing the segmented-line graph, they will realize that the segmented-line graph does not fit their intuitive understanding of a constantly changing (instantaneous) speed, and reason that a continuous graph better represents the process of filling a cocktail glass. That conception is then deepened qualitatively and quantitatively by comparing the speed at a given point in the cocktail glass with the constant speed in a cylindrical highball glass with a corresponding width. Supported by a computer simulation, students are enabled to construe an imaginary highball glass as a tool for determining the instantaneous speed at a given point in the cocktail glass. Next, this conception is extended to graphs by linking the linear graph of the highball glass with the tangent line at a corresponding point of the cocktail glass’ curve.
This understanding of instantaneous speed in terms of graphs and tangent-lines may be expanded into a more generalized, quantitative understanding of instantaneous speed.
2 Thesis
- Chapter 1. Introduction
- Chapter 2. Investigating 5th grade students’ level of covariational reasoning
- Chapter 3. Discrete and continuous reasoning about change in primary school classrooms
- Chapter 4. Design research as an augmented form of educational design: Teaching instantaneous speed in 5th grade (not yet published)
- Chapter 5. A proposed LIT for teaching instantaneous speed in grade five
- Chapter 6. Conclusions and discussion
- Summary
- Bibliography:
Download my thesis as a PDF file (2.7 MB).
3 Educational materials created and used during the design research
- Starting Up
- Design Experiment 1
- Design Experiment 2
- Design Experiment 3
The software used in the latest experiment is released as a standalone application FlaskFiller.
4 Publications
-
Huub de Beer, Koeno Gravemeijer, & Michiel van Eijck (2018) ‘Exploring Instantaneous Speed in Fifth Grade’ Educational Designer Vol. 3, No. 10 http://www.educationaldesigner.org/ed/volume3/issue10/article39/.
-
Huub de Beer, Koeno Gravemeijer, & Michiel van Eijck (2017) ‘A proposed local instruction theory for teaching instantaneous speed in grade five’ The Mathematics Enthusiast Vol. 14, No. 1, 435—468. http://scholarworks.umt.edu/tme/vol14/iss1/24/.
-
Huub de Beer (2016) Exploring instantaneous speed in grade 5. A design research PhD. Thesis Eindhoven University of Technology (html|pdf)
-
Huub de Beer, Koeno Gravemeijer, & Michiel van Eijck (2015) ‘Discrete and continuous reasoning about change in primary school classrooms’ ZDM Mathematics Education, doi:10.1007/s11858-015-0684-5 (html|pdf)